
Tracking sales metrics and performance metrics is crucial to identifying growth opportunities, process gaps, and operational issues. Metrics play an important role in sales planning and operations to increase overall sales. But what exactly are sales metrics and performance metrics? And how do you capture them? In this article, we identify key metrics, why it is important to measure them, and how to turn them into an actionable sales strategy.
1. What Are Sales Metrics?
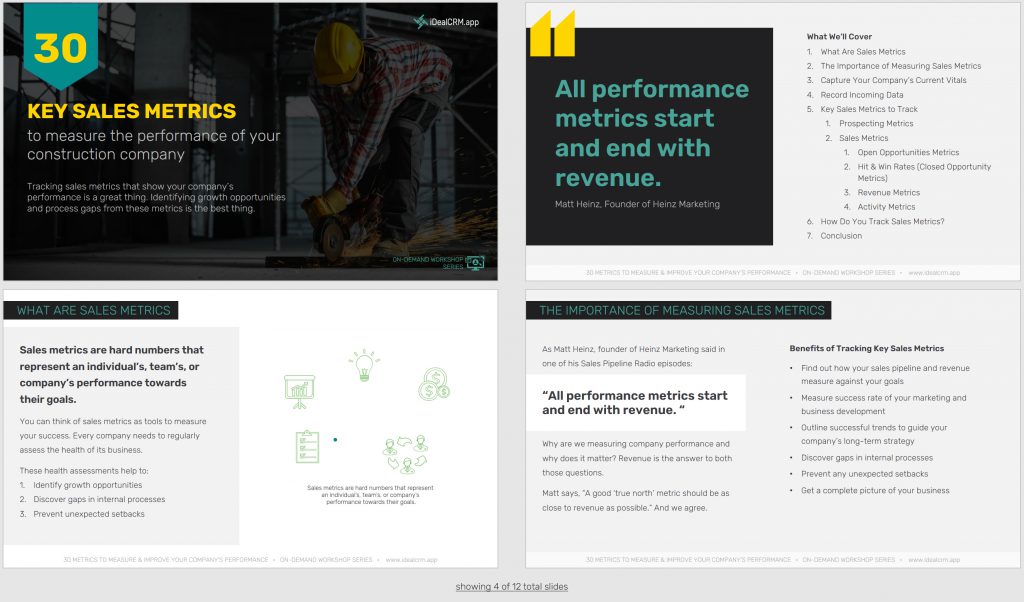
Sales Metrics Definition: Sales metrics are hard numbers that represent the performance of an individual, team, or company towards their goals.
Sales Metrics KPI are key performance indicators (KPIs) specific to your company. In other words, how do you and your sales team measure up against your sales goals, what are you doing right, and where are the future opportunities for sales operations!
In short, these “health assessments” help to:
- Identify growth opportunities
- Discover gaps in internal processes
- Prevent unexpected setbacks
2. The Importance of Measuring Metrics
Why are metrics for sales performance important?
Metrics keep your organization competitive and profitable. Or as Matt Heinz, founder of Heinz Marketing said in one of his Sales Pipeline Radio episodes, “All performance metrics start and end with revenue.”
Why are we measuring company performance and why does it matter? Revenue is the answer to both those questions. Matt says “A good ‘true north’ metric should be as close to revenue as possible.” And we agree.
3. Capture Your Company’s Current Vitals
This is the typical wash, rinse, dry, and repeat cycle. First of all, you need to identify strategic goals. In other words, establish what success looks like by outlining concrete benchmarks or SMART goals (Specific, Measurable, Achievable, Realistic, Timely). A couple examples of SMART goals would be:
- number of new prospects in your sales pipeline each month (marketing goal)
- % Proposals to win rate (sales goal)
Then measure them. And direct your marketing and sales efforts accordingly going forward. Over and over again.
Be sure to define key terms for your sales and marketing teams. These terms will be used to establish what to track and how, for example, best-performing client, low-performing client, hot lead, project category, and all the sales pipeline stages that match your sales process.
4. Record Incoming Sales Data
Recording incoming data for your leads, clients, and opportunities will help you calculate and analyze performance metrics, especially the more complex ones. We recommend recording the following 17 data points, either with the help of a sales CRM for construction or in an Excel spreadsheet.
- Location – at least city & state for each opportunity
- Bid Due Date –date (and time if necessary) when bid is due
- Follow-up Date – date you want to follow-up on
- Expected Close Date – approximate date of close
- Opportunity Sales Manager – person in charge of opportunity
- Main Contact –main point of contact at client company
- Value – $ amount for opportunity
- Stage – based on your sales pipeline stages
- Status – different than stage; can be proposal status as sent or received, or contact status as warm, hot, cold
- Win Probability – usually 1 to 5-star rating for opportunity
- view more…
5. Examples of Sales Metrics to Track
Key metrics for sales managers include marketing metrics. It is important to determine how well your sales funnel is serving you and identify what works and what not. Focus sales and marketing efforts where they are most effective! Metrics that matter for sales enablement include:
Prospecting Metrics
Prospects or Leads could be a new contact you made at a tradeshow, a rumor you heard about a new project coming up, or a request or question via your website. Whatever a lead means to your company, they need to be included in your sales pipeline, and prospecting metrics will help to measure the health of your marketing and direct ongoing prospecting efforts.
For example, common sales metrics related to prospects include ‘new monthly leads’ or ‘leads by stage’. To view all prospecting metrics, download the sales metrics presentation.
Sales Metrics
Likewise, sales metrics can be looked at from multiple perspectives: opportunity, contact, client, personnel, revenue, sales activities, and more.
Track the metrics in the categories below that make the most sense for your company. View all details in our presentation on the topic.
Open Opportunity Metrics (# and $)
It is important to know where each opportunity is at, e.g., by stage, by bid date, by project type, expected close date. These are great examples of sales pipeline metrics.
Hit (Win) Rates & Conversion Rates
These are great examples of performance metrics. Here you need the hit rate or ratio of # of projects won from # of projects bid. Even more important is conversion rate, i.e. $ value of projects won from total $ value of projects bid.
Revenue Metrics
These metrics provide insights on pipeline health and revenue, narrowing it down to client company, sales manager, personnel performance, project type, and average deal size. The latter tells you whether your contracts are getting bigger, smaller, or they’re staying the same.
Activity-Related Metrics
This is of course not a surprise to you, but follow-up is key to closing sales and keeping metrics of average # of follow-ups for won deals and staff members who engage clients the most provide direction and incentive for others.
6. How Do You Track Sales Metrics
Tracking business performance metrics is one of the key activities that top-performing companies excel at. And they not only track clients, but also opportunities & activities. They go so deep with their tracking that they can produce a variety of business reports at a moment’s notice.
You can track these metrics with a Sales Metrics Dashboard in a Sales Management Software or a Sales Metrics Template in Excel. Regardless of how you choose to track this data, we highly recommend that you do. The ROI is tremendous.
7. How Do You Calculate Performance Metrics
Now that we have performance metrics examples and sales metrics examples the question is how do we calculate them? As we’ve explained from the beginning of this article up to this point, the process is rather simple.
- Set Up Goals (preferably SMART goals)
- Take Your Current Vitals (so you know where you stand)
- Establish the performance metrics important to your company
- Measure them
- Compare them to your goals
You now have an overview of your company’s performance against your goals.
8. Conclusion
In conclusion, key metrics not only measure but direct your business’s profitability. Learn what worked, how it worked, why it worked, and apply the insights to increase overall sales going forward. It’s not difficult to do. You can capture metrics in an Excel spreadsheet, or leverage a CRM like iDeal, it doesn’t matter, only that you do… To remain competitive and successful!
Further Reading