
If you’re interested in a particular sales forecasting topic, feel free to jump ahead:
- Sales forecasting definition
- Difference between sales forecasting and sales goals
- What’s needed for accurate sales forecasting
- Sales forecasting methods
- Based on historical data
- Using opportunity stages
- Pipeline Forecasting
- Building a custom forecasting model that combines several methods
- Sales forecasting examples
- Forecasting tools
- Conclusion
Sales Forecasting Definition
Simply put, sales forecasting is the process of estimating what future sales may look like at your company. Sales forecasting answers the question ‘Will we hit our revenue target with the current sales pipeline?’ Companies use sales forecasts to predict weekly, monthly, quarterly, and annual revenue and break-even point. Tracking forecasts against your goals is important in predicting how likely you are to hit your revenue targets. Tracking forecasts against actual sales is important to determine and improve the accuracy of your forecasts.
Companies typically base their forecasts on past sales data, current sales pipeline, industry-specific opportunities and challenges, and of course, economic trends. There are also other factors that can help to forecast sales, for example, a company’s sales team and processes, including the technology it leverages to manage sales.
“While knowing your breakeven point is good, it’s even better to know when in the year you’ll reach it. A sales forecast will help you predict that as well as how much you might exceed it. It takes work (and humility) to create it, and demands that you communicate both with your staff and your customers. The results, however, will not only show you where you will be at the close of the season, but the planning will enable you to avoid obstacles and take advantage of opportunities as they arise.”
Samuel Mullen, Founder & Owner of Mesa.
The Differences Between Sales Forecasting and Sales Goals
Building a sales pipeline for your organization is a methodical process with several steps that need to be executed and tested. First, you need to define and document your sales process. Then, you create sales
Sales goals are objectives for your sales team that define what you want to happen in a set period of time. They focus your salespeople’s attention on what’s important and give them direction on what to do.
Sales forecasting predicts with a certain amount of accuracy what is going to happen in terms of revenue and sales.
Both sales goals and sales forecasting are important to sales performance and achieving your company’s revenue goals.
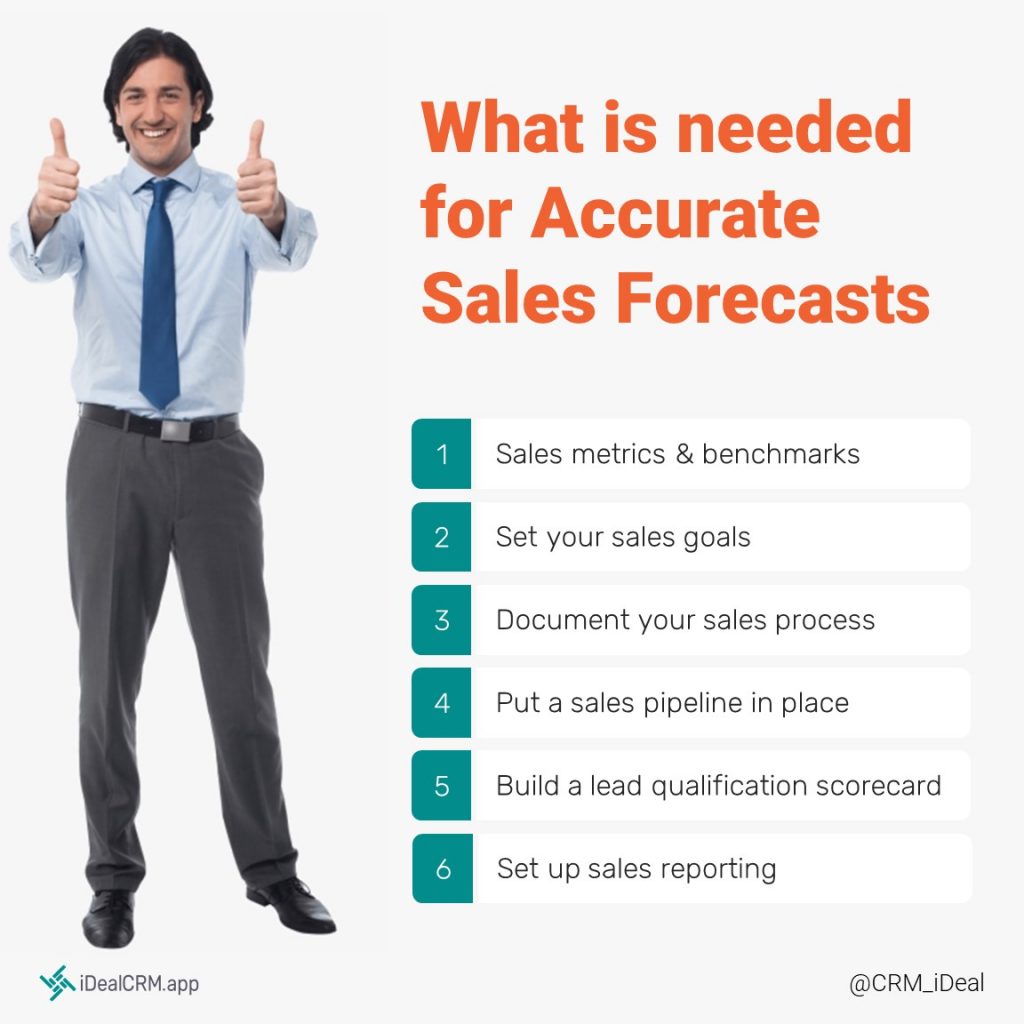
What Is Needed for Accurate Sales Forecasting
Forecasting by definition is an estimation and therefore never 100% accurate. However, there are certain best practices you can implement to get higher accuracy in your forecasts.
Establish sales metrics and benchmarks
Some sales metrics will help you forecast easier and with higher accuracy. Examples of such sales metrics include:
- Past and current revenue (real sales data)
- Average number of new leads or opportunities
- How long does it take to turn a lead into a customer
- Your overall win rate
- How often do you get repeat business and who do you get it from
- For repeat customers, what is your win rate with them
- Average opportunity price (you can get more granular based on product/service type)
- Probability to win the lead/opportunity
Set your sales goals
Measuring success requires goals and revenue targets. And sales forecasting is more valuable when you measure it against your goals. When setting sales goals, start from the overarching company revenue target. Then set quotas for each sales department. And lastly drill down and set quotas for each sales representative.
Document your sales process
A well-defined sales process with clear steps and actions to close deals is crucial to your sales team and your company’s success. It is also crucial to predicting the probability of winning a deal/opportunity/new client. Your sales process should include every step from new lead to opportunity to won deal along with very specific actions a sales person should take in order to move to the next step.
Put a sales pipeline in place
Using the proper sales pipeline or sales funnel is as critical as having a sales process in place. A sales pipeline is a visual representation of all your opportunities and leads/prospects and their respective stages. Sales pipeline stages are the steps each prospects goes through from lead to client and each opportunity goes through from new opportunity to won project.
Typical sales pipeline stages for prospects are: prospecting, contact, lead qualification, lead nurturing, presentation, follow-up with lead, receive the opportunity, and finally close deal. Typical sales pipeline stages for opportunities are: new opportunity, gathering info, go/no-go, estimating, proposal creation, send proposal, follow up, close opportunity, and finally reporting and analysis. Building a sound sales pipeline for your company involves implementing a sales pipeline tool like a sales tracking system or at least an Excel spreadsheet. Ideally, the sales pipeline or funnel system you put in place, will allow you to also score your leads and opportunities.
Build an opportunity or lead qualification scorecard (or both depending on your industry)
A lead qualification scorecard differentiates the leads by scoring them or assigning numbers to them. The higher the number the better the lead. Scorecards usually have several sections, each scored from 1 to 5. For example lead source can be requested service via phone or website (5), recommendation from existing customer (4), stopped by booth at tradeshow (3), downloaded a brochure or whitepaper from the website (2), acquired list (1). Another example would be timeline – is the proposed timeline feasible for you. Once you score your opportunities and leads, store the score in your sales pipeline system for future reporting.
Document Real Sales
Collecting data about leads is not enough when it comes to forecasting. You also need to track real sales. After you’ve forecasted sales for a while, you can compare your forecast to the real sales. This is especially useful to fine tune your probability to win numbers and lead scoring. It is through this comparison that your forecasts will become more accurate.
Set up reporting
Lastly, to make sense of all the metrics and data you’ve been collecting on your leads and opportunities, you need forecasting reports. Weekly, monthly, quarterly, and yearly sales forecasting reports will present your future sales in a visual format. They also help you identify potential revenue dips ahead of time so you can rectify them.
Sales Forecasting Methods
There are many sales forecasting methods that you can use. The more complex the sales process in your business and industry, the more complicated your sales forecasting process will be. In the construction industry for example, you can achieve more accurate forecasts by using a custom model with deal scoring, current sales pipeline, and historical data.
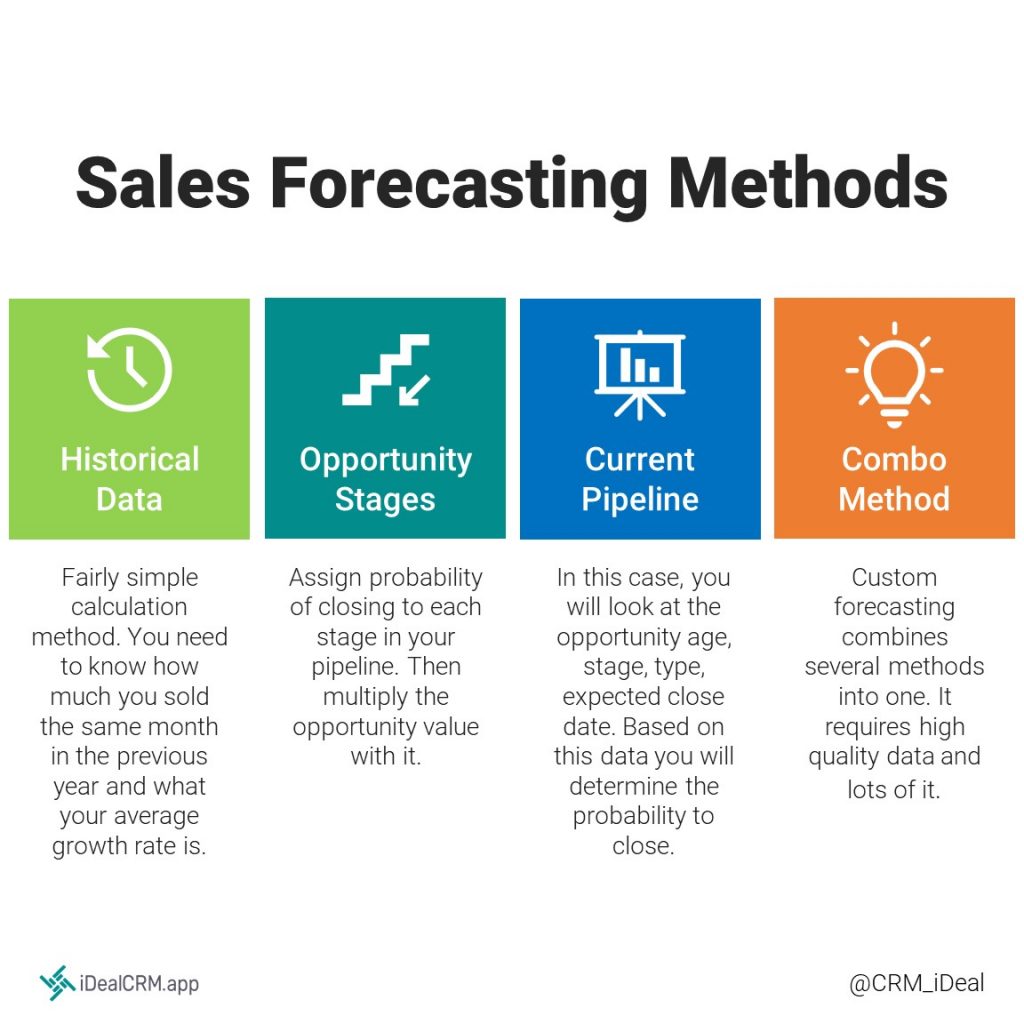
Based on historical data
Sales forecasting based on historical data is a fairly simple calculation method. What you need to know is how much you sold the same month in the previous year and what your average growth rate is.
To calculate your month-to-month growth rate use this formula
(Mar Revenue – Feb Revenue ) / Feb Revenue * 100
This method doesn’t take into account certain factors such as the current number of sales people compared to last year’s number.
Using opportunity stages
When you are forecasting using opportunity stages, you assign percentages for probability of closing to the different stages in your pipeline. Once you have a percentage for each stage, you can simply multiply the opportunity values with it to find out your estimated revenue. For example, you may have website download at 20%, demo at 40%, expressed interest during demo at 60%.
This method is more accurate than forecasting by historical data, but it still has its own caveats. For example it doesn’t take into account deal type. Or you are more likely to close one type of deal/prospect than others.
Pipeline Forecasting
Sales forecasting based on your current pipeline is a more sophisticated approach that engages several methods into one. In this case, you will look at the opportunity age, stage, type, expected close date. Based on this data you will determine the probability to close and you will multiply that by the opportunity value to get the forecast amount. This forecasting method requires high quality of data and is usually implemented in a sales software system that is capable of analyzing all your opportunities.
Building a custom sales forecasting model that combines several methods
Custom forecasting is by far the most accurate one as it combines several methods into one. It does require high quality data and lots of it, so it is highly dependent on your sales reps inputting data into your sales system. This is not a method that can be accomplished with a spreadsheet and requires several reports for you to extract information from. Custom forecasting is similar to pipeline forecasting, it may just look at different criteria.
Sales Forecasting Examples
Example of Sales Forecasting Based on Historical Data
For example, let’s say you want to forecast sales for Q2 current year.
What you need to know is revenue for Q2 from the previous year and your average month-to-month growth rate.
Previous Year Revenue
Jan – $290,000
Feb – $270,000
Mar – $325,000
Apr – $285,000
May – $310,000
Jun – $320,000
Month-to-month growth rate
Jan-Feb: (270,000-290,000) / 290,000 * 100 = (-6.89)%
Feb-Mar: (325,000-270,000) / 270,000 * 100 = 20.37%
Mar-Apr: (285,000-325,000) / 325,000 * 100 = (-12.3)%
Apr-May: (310,000-285,000) / 285,000 * 100 = 8.77%
May-Jun: (320,000-310,000) / 310,000 * 100 = 3.22%
Average month-to-month growth rate: (-6.89 + 20.37 – 12.3 + 8.77 + 3.22) / 5 = 2.6%
Forecast for Q2 current year:
Apr: $285,000 + ($285,000 * 0.026) = $292,410
May: $310,000 + ($310,000 * 0.026) = $318,060
Jun: $320,000 + ($320,000 * 0.026) = $328,320
Example of Pipeline Forecasting
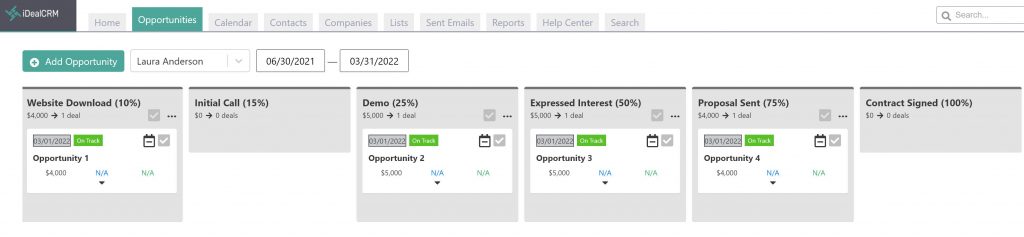
Let’s assume that you have the following pipeline stages and probability of closing for each:
- Website Download – 10%
- Initial Call – 15%
- Demo – 25%
- Expressed Interest – 50%
- Proposal Sent – 75%
- Contract Signed – 100%
And Opportunities 1, 2, 3, and 4 with various values. To calculate the forecast amount for each opportunity, we multiply its value by the probability percent. Then we sum all of them up to find our total forecast value. The table below shows our total pipeline value and total forecast value.
| Name | Stage | Value | Forecast |
| Opportunity 1 | Website Download (10%) | $4,000 | $400 |
| Opportunity 2 | Demo (25%) | $5,000 | $1,250 |
| Opportunity 3 | Expressed Interest (50%) | $5,000 | $2,500 |
| Opportunity 4 | Proposal Sent (75%) | $4,000 | $3,000 |
| Totals | $18,000 | $7,150 |
Forecasting Tools
To learn more about how these forecasting tools work, find a time that works for you and talk to one of our forecasting specialists!
CRM Software
A CRM system is probably the most powerful tool for forecasting because you can store all the information you need and you have the tools to retrieve that data in meaningful formats. CRM features include lead tracking, sales pipeline management, data storing, lead scoring, probability to close measuring, analytics, and reporting. The key is to input high quality data and select the right CRM for your business. For example, a CRM that works for most industries doesn’t work for the construction industry, especially when bidding multiple clients is involved. For a construction company, you need a construction CRM.
Excel or Google Sheets
If you have a small sales team or your company is just starting out, Excel or Google Sheets may work just fine for you. You can keep all your pipeline information in one and you can also build charts to help you visualize your data. Keep in mind though that this is a fairly limited tool with a time-consuming process to keep it up to date. Also, we’d like to suggest Google Sheets over an Excel spreadsheet because you can share it with your entire sales team and everyone can collaborate and see real-time changes.
Accounting Software for Sales Forecasting
If you want to forecast more than future sales and revenue, but also profits, costs, or margins for example, then you need to use data from your accounting software along with your sales data. These types of forecasting reports become very robust, but they do require more time investment from everyone involved.
Conclusion
It is important to make informed business decisions when predicting sales performance.Nobody has a crystal ball but companies typically base their forecasts on past sales data, current sales pipeline, industry-specific opportunities and challenges, and of course, economic trends. There are also other factors that can help to forecast sales, for example, a company’s sales team and processes, including the technology it leverages to manage sales.
Unfortunately, according to Gartner, many B2B enterprise sales organizations continue to rely on intuition instead of data analytics or their B2B CRM, resulting in inaccurate forecasts, ineffective sales pipelines, and missed quotas.
With a CRM or sales management software, your sales team has the tools it needs to track all the metrics, lead scoring, past, current and future sales, and reporting so you can generate accurate sales forecasts. If you run or work at a construction company, the best CRM for construction is iDeal CRM.